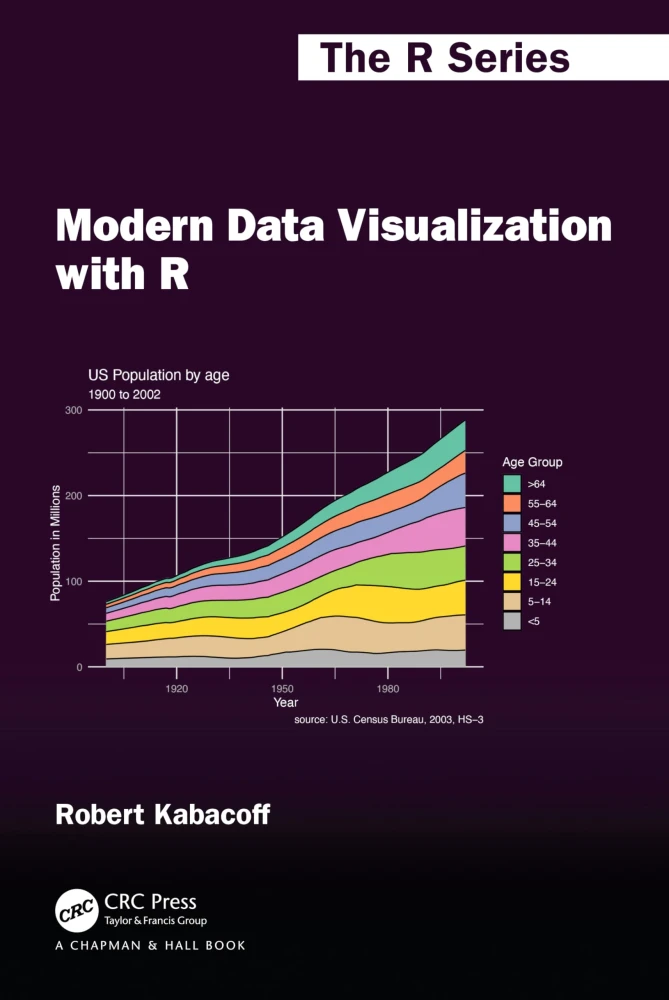
Modern Data Visualization with R
Book Details
| Author | Robert Kabacoff |
| Publisher | CRC Press |
| Published | 2024 |
| Edition | 1st |
| Paperback | 271 pages |
| Language | English |
| ISBN-13 | 9781032287607 |
| ISBN-10 | 1032287608 |
| License | Creative Commons Attribution-NonCommercial-NoDerivatives |
Book Description
Modern Data Visualization with R describes the many ways that raw and summary data can be turned into visualizations that convey meaningful insights. It starts with basic graphs such as bar charts, scatter plots, and line charts, but progresses to less well-known visualizations such as tree maps, alluvial plots, radar charts, mosaic plots, effects plots, correlation plots, biplots, and the mapping of geographic data. Both static and interactive graphics are described and the use of color, shape, shading, grouping, annotation, and animations are covered in detail. The book moves from a default look and feel for graphs, to graphs with customized colors, fonts, legends, annotations, and organizational themes.
- Contains a wide breadth of graph types including newer and less well-known approaches
- Connects each graph type to the characteristics of the data and the goals of the analysis
- Moves the reader from simple graphs describing one variable to building visualizations that describe complex relationships among many variables
- Provides newer approaches to creating interactive web graphics via JavaScript libraries
- Details how to customize each graph type to meet users' needs and those of their audiences
- Gives methods for creating visualizations that are publication ready for print (in color or black and white) and the web
- Suggests best practices
- Offers examples from a wide variety of fields
The open book is written for those new to data analysis as well as the seasoned data scientist. It can be used for both teaching and research, and will particularly appeal to anyone who needs to describe data visually and wants to find and emulate the most appropriate method quickly. The reader should have some basic coding experience, but expertise in R is not required. Some of the later chapters (e.g., visualizing statistical models) assume exposure to statistical inference at the level of analysis of variance and regression.
This book is available under a Creative Commons Attribution-NonCommercial-NoDerivatives license (CC BY-NC-ND), which means that you are free to copy and distribute it, as long as you attribute the source, don't use it commercially, and don't create modified versions.
If you enjoyed the book and would like to support the author, you can purchase a printed copy (hardcover or paperback) from official retailers.
Download and Read Links
Share this Book
[localhost]# find . -name "*Similar_Books*"
Critical Data Literacy
A short course for students to increase their proficiency in analyzing and interpreting data visualizations. By completing this short course students will be able to explain the importance of data literacy, identify data visualization issues in order to improve their own skills in data story-telling. The intended outcome of this course is to help s
Introduction to Data Science
Introduction to Data Science: Data Analysis and Prediction Algorithms with R introduces concepts and skills that can help you tackle real-world data analysis challenges. It covers concepts from probability, statistical inference, linear regression, and machine learning. It also helps you develop skills such as R programming, data wrangling, data vi
Data Visualization with Category Theory and Geometry
This open access book provides a robust exposition of the mathematical foundations of data representation, focusing on two essential pillars of dimensionality reduction methods, namely geometry in general and Riemannian geometry in particular, and category theory. Presenting a list of examples consisting of both geometric objects and empirical data
Python Data Science Handbook
For many researchers, Python is a first-class tool mainly because of its libraries for storing, manipulating, and gaining insight from data. Several resources exist for individual pieces of this data science stack, but only with the Python Data Science Handbook do you get them all - IPython, NumPy, Pandas, Matplotlib, Scikit-Learn, and other relate
Building Modern Web Applications With Spring Boot and Vaadin
This guide is a practical introduction to web application development with Spring Boot and Vaadin. It covers the entire development process, from setup to deployment, following a step-by-step approach. You can replicate each section at your own pace as you follow along. The content is suitable for anyone familiar with Java who wants to build a web
R for Data Science
Learn how to use R to turn raw data into insight, knowledge, and understanding. This book introduces you to R, RStudio, and the tidyverse, a collection of R packages designed to work together to make data science fast, fluent, and fun. Suitable for readers with no previous programming experience, R for Data Science is designed to get you doing data