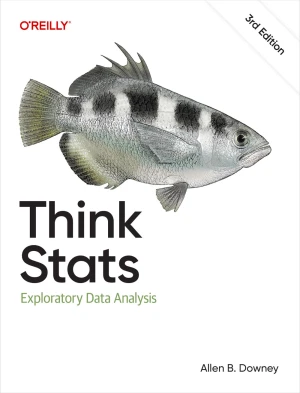
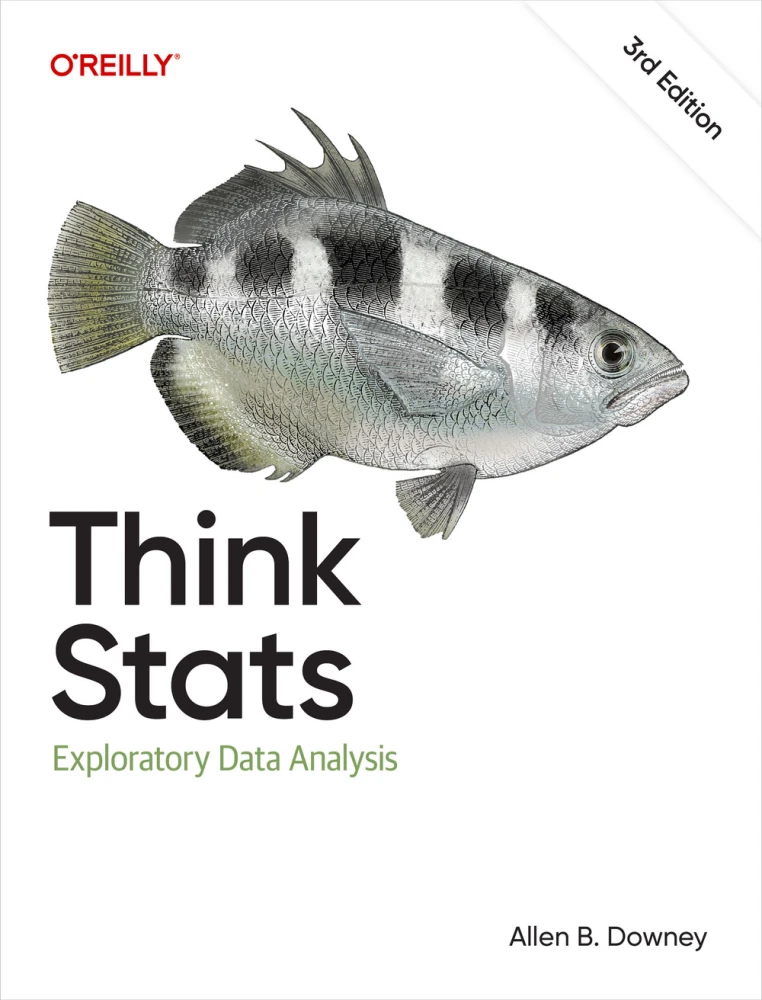
Think Stats, 3rd Edition
Exploratory Data Analysis
Book Details
| Author | Allen Downey |
| Publisher | O'Reilly Media, Green Tea Press |
| Published | 2025 |
| Edition | 3rd |
| Paperback | 324 pages |
| Language | English |
| ISBN-13 | 9781098190255, 9781098190255 |
| ISBN-10 | 1098190254, 1098190254 |
| License | Creative Commons Attribution |
Book Description
If you know how to program, you have the skills to turn data into knowledge. This thoroughly revised edition presents statistical concepts computationally, rather than mathematically, using programs written in Python. Through practical examples and exercises based on real-world datasets, you'll learn the entire process of exploratory data analysis - from wrangling data and generating statistics to identifying patterns and testing hypotheses.
Whether you're a data scientist, software engineer, or data enthusiast, you'll get up to speed on commonly used tools including NumPy, SciPy, and Pandas. You'll explore distributions, relationships between variables, visualization, and many other concepts. And all chapters are available as Jupyter notebooks, so you can read the text, run the code, and work on exercises all in one place.
- Analyze data distributions and visualize patterns using Python libraries
- Improve predictions and insights with regression models
- Dive into specialized topics like time series analysis and survival analysis
- Integrate statistical techniques and tools for validation, inference, and more
- Communicate findings with effective data visualization
- Troubleshoot common data analysis challenges
- Boost reproducibility and collaboration in data analysis projects with interactive notebooks
This book is available under a Creative Commons Attribution license (CC BY), which means that you are free to copy, distribute, and modify it, as long as you give appropriate credit to the original author.
If you enjoyed the book and would like to support the author, you can purchase a printed copy (hardcover or paperback) from official retailers.
Download and Read Links
Share this Book
[localhost]# find . -name "*Similar_Books*"
Think Stats, 2nd Edition
If you know how to program, you have the skills to turn data into knowledge, using tools of probability and statistics. This concise introduction shows you how to perform statistical analysis computationally, rather than mathematically, with programs written in Python. By working with a single case study throughout this thoroughly revised book, you
R for Data Science
Learn how to use R to turn raw data into insight, knowledge, and understanding. This book introduces you to R, RStudio, and the tidyverse, a collection of R packages designed to work together to make data science fast, fluent, and fun. Suitable for readers with no previous programming experience, R for Data Science is designed to get you doing data
Introduction to Data Science
Introduction to Data Science: Data Analysis and Prediction Algorithms with R introduces concepts and skills that can help you tackle real-world data analysis challenges. It covers concepts from probability, statistical inference, linear regression, and machine learning. It also helps you develop skills such as R programming, data wrangling, data vi
Elements of Data Science
Elements of Data Science is an introduction to the practical skills of working with data, written for people with no programming experience. Concepts are explained clearly and concisely, and exercises in each chapter demonstrate the real-world use of each feature. - Step-by-Step Approach: Learn how to execute a data science project from start to fi
Critical Data Literacy
A short course for students to increase their proficiency in analyzing and interpreting data visualizations. By completing this short course students will be able to explain the importance of data literacy, identify data visualization issues in order to improve their own skills in data story-telling. The intended outcome of this course is to help s
Think Python, 2nd Edition
If you want to learn how to program, working with Python is an excellent way to start. This hands-on guide takes you through the language a step at a time, beginning with basic programming concepts before moving on to functions, recursion, data structures, and object-oriented design. This second edition and its supporting code have been updated for

